Ethereum Price Outlook - Feb 15th 2023

C
#Blockchain #BlockSec #OSINT #CyberSec #Darkweb | Isaiah 54:17 Fingerpint: 54EADD6FCBCF520E37A003E04D3ECE027AEFA381
Search for a command to run...
#Blockchain #BlockSec #OSINT #CyberSec #Darkweb | Isaiah 54:17 Fingerpint: 54EADD6FCBCF520E37A003E04D3ECE027AEFA381
No comments yet. Be the first to comment.
There's been a ton of volatility surrounding Bitcoin's price as of recent, so we're going to check that out and see what's really going on. I assume that this price analysis is coming at a good time for most since there appears to be peak confusion i...

One popular staple of smart contracts is the 'upgradable' smart contract. For those that are familiar with smart contract development, you've likely encountered these types of contracts before. However, if you have not - then this is going to serve a...
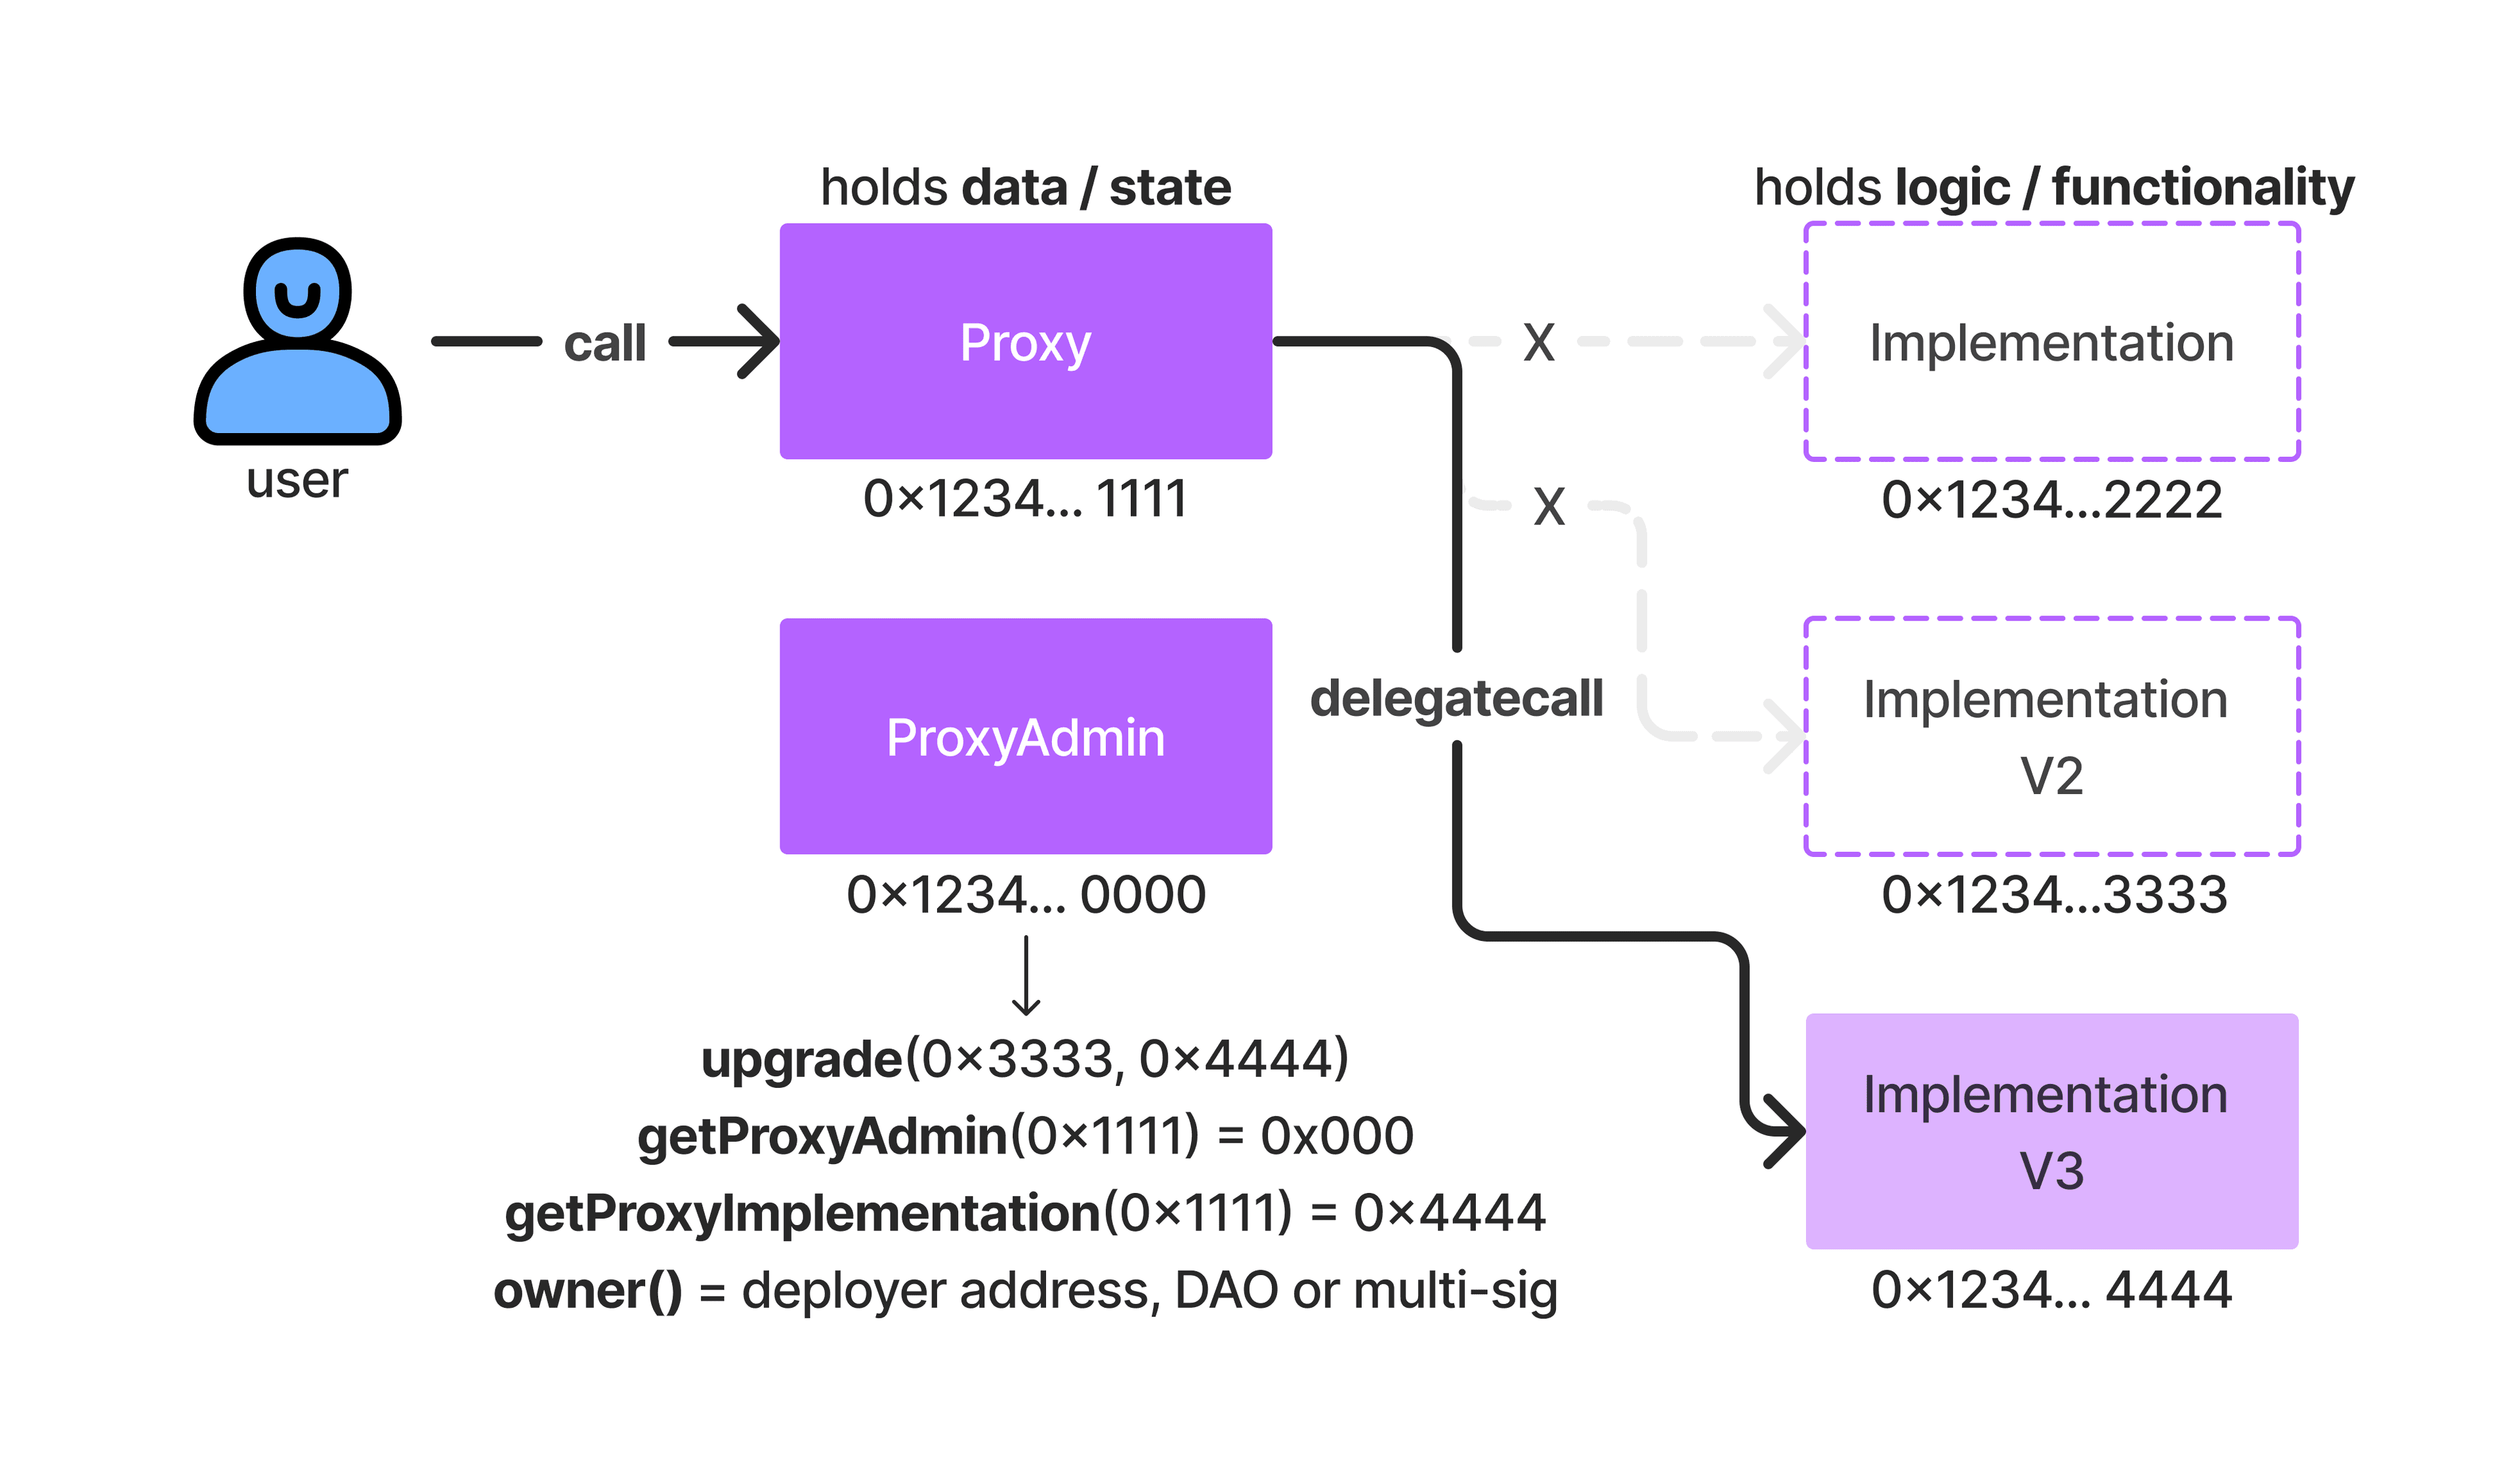
Consider some of the following biographical information related to what we're looking at too: The address of the logic contract / implementation is 0xd9db270c1b5e3bd161e8c8503c55ceabee709552. That contract was created at TX 0x0b04589bdc11585fb98f270...

WazirX is an cryptocurrency exchange primarily based in India with an ambiguous origin story that ties to the now-infamous Binance exchange (see: ChangpengZhao prison sentence). If you're interested to learn more about the connection between Binance ...
Its been a long time since we've done a Bitcoin price analysis. But figured that there's no time better than the present for us to explore exactly what the fuck is going on as it pertains to Bitcoin. First, we're going to look at the overall price ac...


Given the recent price action of Ethereum and the markets, it seemed reasonable to check out how the asset's been doing lately - especially since the price of $ETH is rubbing against a long-term overhead horizontal resistance.

In the chart above, we can see the price recently testing the EMA-50 (successfully) before heading directly up to re-test the overhead horizontal resistance at $1660 or so.
In just under a month, the price of Ethereum has bumped against this overhead horizontal resistance four times.

If we look at our various custom-coded momentum indicators (which are overlaid on top of the price chart itself), we can see that they're near unanimous in signaling 'entry'.


What we're going to see below should spark some intrigue for readers.

As one can see above, the Librehash Reversion Ribbon V2:
Has re-colored all of the candles red.
The ribbon is showing a recent convergence of the ribbon (from 'red' [bearish] to what should eventually be 'green' when the ribbon changes colors once it faster moving average crosses back over the slower one [these two averages form the basis of the ribbon itself]). In layman's terms, this exemplifies a major shift in sentiment for this asset (Ethereum).
The color of the ribbon itself shifted from dark red to a lighter red. This shift occurred on February 10th, 2023 (less than 5 days ago before we saw this shift in sentiment reflected in the price).
The ribbon dipped just below the histogram, but it appears to be curving back upward, currently in a trajectory to cross back above the histogram (zero line).

This is a custom momentum indicator that we've created to track the underlying buy/sell pressure for a given asset.
The biggest benefit conferred by this indicator is its ability to track underlying shifts in buying/selling activity well before other indicators can (like the RSI(14)).

In the photo above, we can see that the inflection point for this indicator was on February 13th, 2023.
In this case, the indicator was not premature in its signal as it aligned with the pivot in price action that occurred on that same day as well.

While the Balance of Power RSI on the daily resolution isn't too insightful, the weekly resolution provides us with a great look at an underlying shift from bullish exuberance to gradually increased bearish price action (selling).

Upon closer look, we can see the shift in the Balance of Power RSI's trend (overall direction; think 'line of best fit').

Closer observation reveals that the 'second high' (localized) is lower than the first one.

Let's look at the other momentum indicators vs. the Balance of Power RSI over the same timeframe.
Librehash RSI(14)

Cryptomedication Volatility RSI
This one tracks momentum

As we can see from the charts above, the Balance of Power RSI strongly contradicts the Librehash RSI & Cryptomedication Volatility RSI.
In this case, we're going to place more weight on the Balance of Power RSI than the latter two indicators due to the fact that it's specifically designed to track underlying changes in sentiments well ahead of other indicators.
We're going to abstain from entering into a position on Ethereum here.
It is likely that the price will continue to increase in the short term, but we can't see enough upside over the medium term to justify entry into a 'long' position at the time of writing.
We're also not going to be crazy enough to advocate for a short since the prevailing market sentiment seems to be overwhelmingly bullish at this point (compared to where it was toward the beginning to mid-Fall 2022).